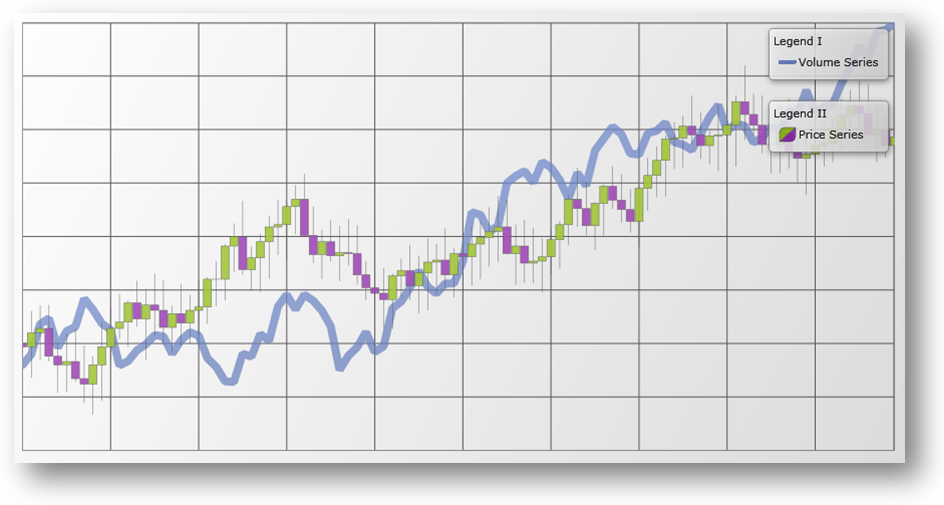
By default, the XamDataChart™ does not display a Legend for series added in the chart plot area. If you want to show an individual Legend for each series, you need to add a number of Legend objects to the container of XamDataChart control and then bind each Legend to corresponding Series object’s Legend property. In addition, you must set the Title property for each Series object otherwise its corresponding legend item will display a default series title.
The following example code demonstrates how to add individual Legend for each series defined in the XamDataChart control.
<Grid>
    <Grid.RowDefinitions>
        <RowDefinition Height="Auto" />
        <RowDefinition Height="Auto" />
        <RowDefinition Height="*" />
    </Grid.RowDefinitions>
    <Grid.ColumnDefinitions>
        <ColumnDefinition Width="*" />
        <ColumnDefinition Width="Auto" />
    </Grid.ColumnDefinitions>

    <ig:XamDataChart Grid.ColumnSpan="2" Grid.RowSpan="3">
        ...
        <ig:XamDataChart.Series>
            <ig:LineSeries Title="Volume Series"
                           Legend="{x:Reference Legend1}">
            </ig:LineSeries>
            <ig:FinancialPriceSeries Title="Price Series"
                                     Legend="{x:Reference Legend2}">
            </ig:FinancialPriceSeries>
        </ig:XamDataChart.Series>
    </ig:XamDataChart>
    <ig:Legend x:Name="Legend1"
               Margin="10"
               Grid.Row="0" Grid.Column="1">
    </ig:Legend>
    <ig:Legend x:Name="Legend2"
               Margin="10"
               Grid.Row="1" Grid.Column="1">
    </ig:Legend>
</Grid>
The following image shows how the XamDataChart control might look like with multiple legends.

