This topic explains how to customize the way Key Performance Indicators (KPIs) are visualized in the xamPivotGrid™ and xamPivotDataSelector™ controls.
The following topics are prerequisites to understanding this topic:
This topic contains the following sections:
An individual indicator can be visualized in the xamPivotGrid by drag-and-dropping it from the metadata tree to the Measures area of the pivot grid or by programmatically adding it to its Measures collection.
When applicable (depending on its KPI type), a KPI can be visualized as either a value or a graphical representation (icon).
A pre-defined set of graphical representations (shapes set) is available by default. This setting is controlled by the Graphic property of the KpiCellTemplate objects.
Further customization, such as specifying a user choice of images representing the different KPIs values states (-1, 0 and 1), is possible by setting the Graphic property to “ThreeStateImages ” and then providing the desired image sources (For details, see Configuring KPI visualization summary chart). An alternative approach would be to override the Template property of a KpiCellTemplate instance, providing a custom template.
The following table explains briefly the configurable aspects of KPI visualization in the pivot grid (the xamPivotGrid and xamPivotDataSelector controls) and maps them to the properties with which this configuration is achieved. The green-highlighted tasks in the table are further detailed in this help as individual procedures.
To display the value of a KPI or visualize its graphical representation in the xamPivotGrid programmatically, access a KpiMeasure member from the ICube.Measures collection and add to the DataSourceBase.Measures collection. You need to do this for all KPIs you want to display.
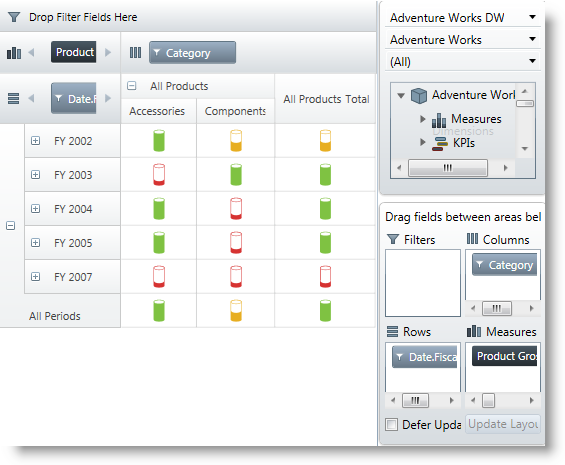
The particular procedure below demonstrates how to add a Status -based KPI graphical representation to the cells of a xamPivotGrid using XMLA as data source (the Adventure Works DW 2008 database).
The following screenshot is a preview of the final result.

To complete the procedure, you need the following:
A WPF application with a page
Instances of xamPivotGrid and xamPivotDataSelector that use XMLA as data source (the Adventure Works DW 2008 database) added to the page
The following steps demonstrate how to display KPIs in the pivot grid programmatically.
Obtain the KPI item from the ICube.Kpis * collection.*
In C#:
IKpi kpi = dataSource.Cube.Kpis["Product Gross Profit Margin"];In Visual Basic:
Dim kpi As IKpi = dataSource.Cube.Kpis("Product Gross Profit Margin")Select the desired metadata type member from the IKpi object created in step 1.
In this procedure, select a Status member.
In C#:
KpiMeasure kpiStatusMeasure = (KpiMeasure)dataSource.Cube.Measures[kpi.KpiStatus];In Visual Basic:
Dim kpiStatusMeasure As KpiMeasure = DirectCast(dataSource.Cube.Measures(kpi.KpiStatus), KpiMeasure)Add the KpiMeasure to the Measures collection of xamPivotGrid ’s data source so that it gets displayed in the Measures area.
In C#:
IMeasureViewModel mvm = dataSource.CreateMeasureViewModel(kpiStatusMeasure);
dataSource.Measures.Add(mvm);
In Visual Basic:
Dim mvm As IMeasureViewModel = dataSource.CreateMeasureViewModel(kpiStatusMeasure)
dataSource.Measures.Add(mvm)A graphical representation of a KPI derived from the Analysis Service (graphic type) is visualized using predefined templates corresponding to that type by default when the respective KpiMeasure has been added to the Measures collection of the DataSourceBase class.
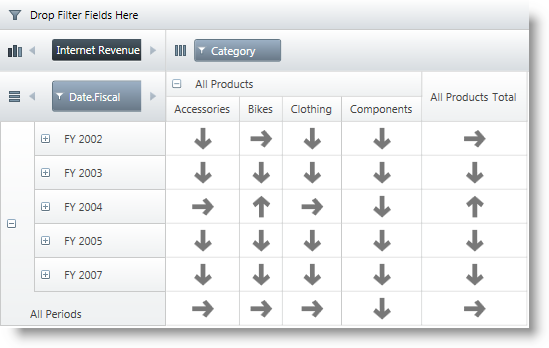
In this procedure, a Status-based key performance indicator is configured to be visualized in the cells of a _xamPivotGrid control using arrow-like shapes (There is a set of predefined shapes in the GraphicType enumeration for visually representing KPI member items.).
The following screenshot is a preview of the final result.

To complete the procedure, you need the following:
A WPF application with a page
An instance of xamPivotGrid using XMLA as data source (the Adventure Works DW 2008 database) added to the page.
Following is a conceptual overview of the process:
Configuring the data source
Choosing the KPI member to be used
Specifying the metadata type of the KPI member
Changing the default graphics
Applying the cell template
The following steps demonstrate how to visualize a Status-based KPI in the cells of xamPivotGrid using arrow-like shapes.
Configure the data source for the xamPivotGrid control. In this procedure, use the following settings:
In XAML:
<igOlap:XmlaDataSource
ServerUri="http://sampledata.infragistics.com/olap/msmdpump.dll"
Database="Adventure Works DW 2008"
Cube="Adventure Works"
Columns="[Product].[Category]"
Rows="[Date].[Fiscal]"
Measures="[Measures].[Internet Revenue Status]"/>To indicate which KPI is going to be used, set the MemberName property of a new KpiCellTemplate instance to the desired value.*In this procedure, set the MemberName property to *“ Internet Revenue ” *. *
In XAML:
----<ig:KpiCellTemplate MemberName="Internet Revenue"/>
----Set the Indicator property of the KpiCellTemplate instance to the desired metadata type.
In this procedure, set the Indicator property to “ Status ”.
In XAML:
<ig:KpiCellTemplate MemberName="Internet Revenue" Indicator="Status"/>From the set of predefined shapes corresponding to the values of the GraphicType enumeration, select a shape to use and set the desired shape as a value for the Graphic property of the KpiCellTemplate object .
In this procedure, set the Graphic property to “ StandardArrow ”.
In XAML:
<ig:KpiCellTemplate MemberName="Internet Revenue" Indicator="Status" Graphic="StandardArrow"/>For a list of pre-defined shapes, please refer to the API documentation.
Add the KpiCellTemplate object to the KpiCellTemplates collection of the xamPivotGrid .
In XAML:
 <ig:XamPivotGrid.KpiCellTemplates>
                <ig:KpiCellTemplate MemberName="Internet Revenue" Indicator="Status" Graphic="StandardArrow"/>
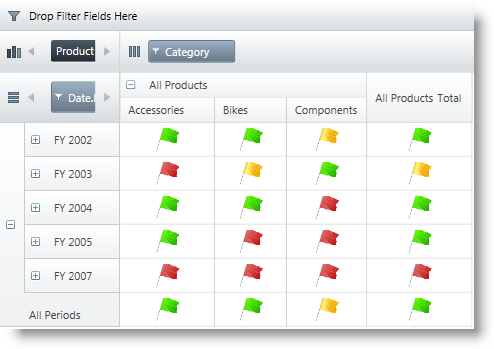
</ig:XamPivotGrid.KpiCellTemplates>To provide a custom visualization, you need a set of custom images to represent each KPI state. You set the Graphic property of the KpiCellTemplate object to “ ThreeState Images” and then provide the images corresponding to each state as values of the respective properties. To apply the template to the cells of the xamPivotGrid the KpiCellTemplate object must be added to xamPivotGrid ’s KpiCellTemplates collection.
The following screenshot is a preview of the final result.

To complete the procedure, you need the following:
A WPF application with a page
An instance of xamPivotGrid using XMLA as data source (the Adventure Works DW 2008 database) added to the page.
The following steps demonstrate how to configure a custom KPI member item visualization using properties.
Configure the data source.
Configure the data source for the xamPivotGrid control. In this procedure, use the following settings:
In XAML:
<igOlap:XmlaDataSource
ServerUri="http://sampledata.infragistics.com/olap/msmdpump.dll"
Database="Adventure Works DW 2008"
Cube="Adventure Works"
Columns="[Product].[Category]"
Rows="[Date].[Fiscal]"
Measures="[Measures].[Product Gross Profit Margin Status]"/>
Configure the use of custom images.
Indicate that three images are going to be explicitly provided to visualize the different KPI values. To do this, set the Graphic property of the KPICellTemplate object to “ ThreeStateImages ”.
In XAML:
<ig:XamPivotGrid.KpiCellTemplates>
                <ig:KpiCellTemplate MemberName="Product Gross Profit Margin"
                                    Indicator="Status"
                                    Graphic="ThreeStateImages"/>
</ig:XamPivotGrid.KpiCellTemplates>
Specify the images.
Use the following snippet to provide the sources of the three images to be displayed as indicators of the three possible KPI member item values- 0, -1 and 1:
In XAML:
<ig:XamPivotGrid.KpiCellTemplates>
                <ig:KpiCellTemplate MemberName="Product Gross Profit Margin"
                                    Indicator="Status"
                                    Graphic="ThreeStateImages"
                                    NegativeImageSource="..\..\StatusFlagRed256.png"
                                    ZeroImageSource="..\..\StatusFlagYellow256.png"
                                    PositiveImageSource="..\..\StatusFlagGreen256.png"/>
</ig:XamPivotGrid.KpiCellTemplates>It is possible to apply a custom template for the graphical representation of a KPI by overriding Template property of an instance of. The KpiCellTemplate object is then added to xamPivotGrid ’s KpiCellTemplates collection. Such an overriding takes precedence over setting the Graphic type to “ThreeStateImages ” and providing the image sources (the approach described in Configuring a Custom Visualization Using Properties).
The DataContext of the template depends on the value for the respective cell. This allows for direct binding to display/ get this value and for using an IValueConverter to translate the value into the required 3-state custom representation in the custom template.