This topic provides information on how to use the GeographicProportionalSymbolSeries element in the XamGeographicMap™ control.
The following topics are prerequisites to understanding this topic:
This topic contains the following sections:
The GeographicProportionalSymbolSeries is a Scatter Series with data-driven symbol sizes. It implements GeographicProportionalSeries and has all the basic characteristics of the XamDataChart control’s BubbleSeries.
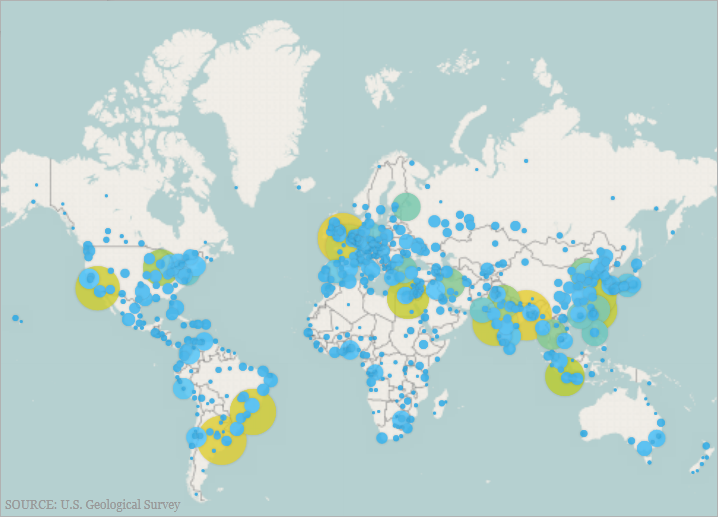
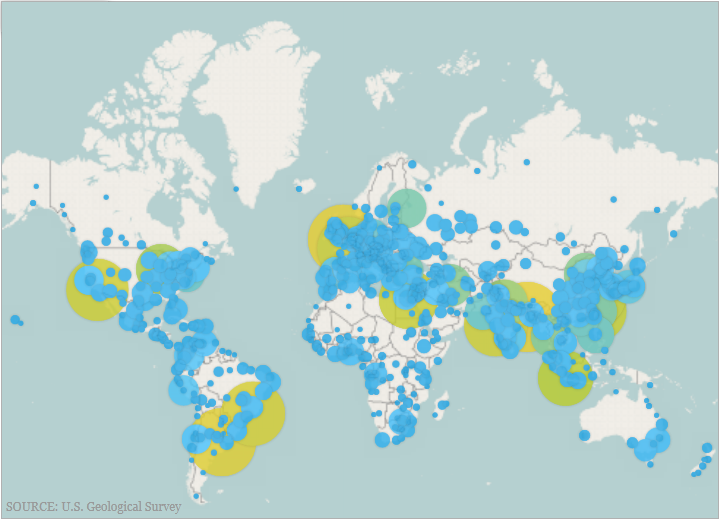
The following screenshot is a preview of the GeographicProportionalSymbolSeries series in the XamGeographicMap control displaying the locations of the most populated cites in the world. The RadiusScale of the symbols uses proportional radius scale in order to indicate the significance of these cities based on their population.

Similar to other types of geographic series in the XamGeographicMap control, the GeographicProportionalSymbolSeries possess an ItemsSource property for data binding. This property can be bound to an object that implements an IEnumerable interface.
Additionally, each item in the items source must have two numeric data columns for storing geographic location (longitude and latitude) and one numeric column for storing the symbol size. These data columns map to the LongitudeMemberPath, LatitudeMemberPath and RadiusMemberPath properties respectively.
The following table summarizes properties of the GeographicProportionalSymbolSeries used for data binding.
In XAML:
<ig:XamGeographicMap x:Name="map">
 <ig:XamGeographicMap.Series>
 <ig:GeographicProportionalSymbolSeries ItemsSource="{StaticResource sampleData}"
 LatitudeMemberPath="LatColumnName"
 LongitudeMemberPath="LongColumnName"
 RadiusMemberPath="RadiusColumnName"/>
 </ig:XamGeographicMap.Series>
</ig:XamGeographicMap>
In Visual Basic:
Imports Infragistics.Controls.Charts
Imports Infragistics.Controls.Maps
Imports System.ComponentModel
' create and set data binding to the GeographicProportionalSymbolSeries
Dim geoSeries = New GeographicProportionalSymbolSeries()
geoSeries.ItemsSource = sampleData
geoSeries.LongitudeMemberPath = "LongColumnName"
geoSeries.LatitudeMemberPath = "LatColumnName"
geoSeries.RadiusMemberPath = "RadiusColumnName"
' add the GeographicProportionalSymbolSeries to the the XamGeographicMap
Me.GeoMap.Series.Add(geoSeries)
In C#:
using Infragistics.Controls.Charts;
using Infragistics.Controls.Maps;
using System.ComponentModel;
// create and set data binding to the GeographicProportionalSymbolSeries
var geoSeries = new GeographicProportionalSymbolSeries();
geoSeries.ItemsSource = sampleData;
geoSeries.LongitudeMemberPath = "LongColumnName";
geoSeries.LatitudeMemberPath = "LatColumnName";
geoSeries.RadiusMemberPath = "RadiusColumnName";
// add the GeographicProportionalSymbolSeries to the the XamGeographicMap
this.GeoMap.Series.Add(geoSeries);The SizeScale determines the size of the symbols in the series. If the SizeScale value is not set, each of the symbol’s sizes is equal to the value of the RadiusMemberPath column. When setting the SizeScale the smallest symbol equals MinimumValue and the largest symbol equals MaximumValue, with all of the remaining symbols scaled proportionately within this range. The SizeScale can be either linear or logarithmic.
The following screenshot demonstrates how the XamGeographicMap control’s GeographicProportionalSymbolSeries series renders as a result of the following SizeScale settings:

Following is the code that implements this example.
In XAML:
<ig:SizeScale x:Key="sizeScale"
 MinimumValue="5"
 MaximumValue="70"
 LogarithmBase="10"
 IsLogarithmic="/>
 <ig:GeographicProportionalSymbolSeries
       ...
RadiusScale="{StaticResource sizeScale}" />A fill scale defines the color pattern within a single GeographicProportionalSymbolSeries. The GeographicProportionalSymbolSeries series’ FillScale property sets the symbols color with each color axis possessing its own collection of Brushes.
The GeographicProportionalSymbolSeries supports two fill scales:
CustomPaletteBrushScale – Uses the symbol marker’s index to select a brush from the Brushes collection
ValueBrushScale – Uses a set of values, which can be logarithmic, from one of the numeric columns in the ItemsSource to interpolate a brush. The GeographicProportionalSymbolSeries series determines which values to use in two ways:
FillMemberPath - the property explicitly specifies which column to use
MinimumValue and MaximumValue – user defined values used to determine the range of values
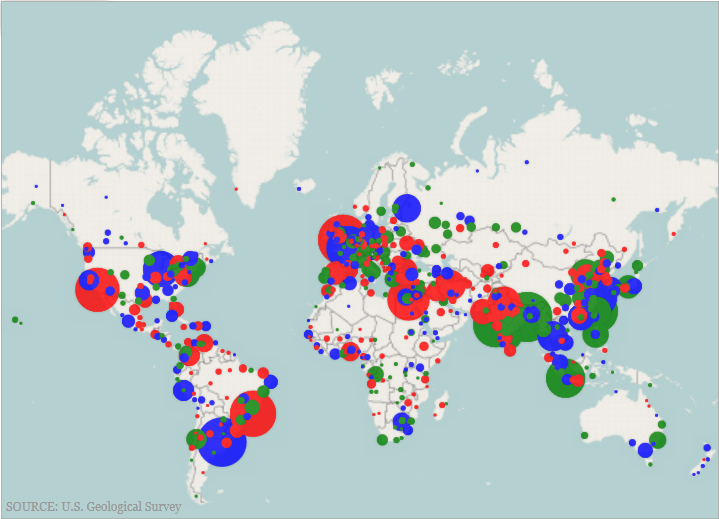
The following screenshot demonstrates how the XamGeographicMap control’s GeographicProportionalSymbolSeries series renders as a result of the following settings:

Following is the code that implements this example.
In XAML:
<ig:CustomPaletteBrushScale x:Key="CustomPaletteBrushScale" >
 <ig:CustomPaletteBrushScale.Brushes>
 <SolidColorBrush Color="Red"/>
 <SolidColorBrush Color="Green"/>
 <SolidColorBrush Color="Blue"/>
 </ig:CustomPaletteBrushScale.Brushes/>
</ig:CustomPaletteBrushScale>
<ig:GeographicProportionalSymbolSeries
   ...
 FillScale="{StaticResource CustomPaletteBrushScale}" />
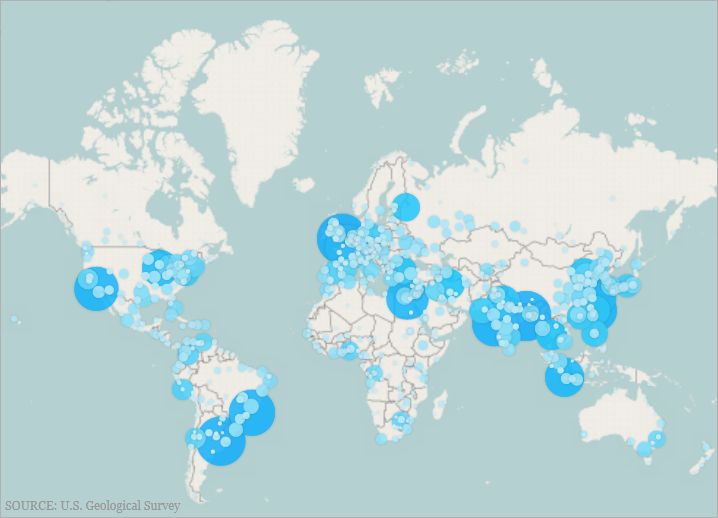
The following screenshot demonstrates how the XamGeographicMap control’s GeographicProportionalSymbolSeries series renders as a result of the following settings:

Following is the code that implements this example.
In XAML:
<ig:ValueBrushScale x:Key="ValueBrushScale"
 MinimumValue="1000"
 MaximumValue="25000000"
 IsLogarithmic="
 LogarithmBase="10">
 <ig:ValueBrushScale.Brushes>
 <SolidColorBrush Color="#FFC6EEFB" />
 <SolidColorBrush Color="#FF08C3FE" />
 <SolidColorBrush Color="#FF08A5FE" />
 <SolidColorBrush Color="#FF086AFE" />
 <SolidColorBrush Color="#FF084CFE" />
 </ig:ValueBrushScale.Brushes>
</ig:ValueBrushScale>
<ig:GeographicProportionalSymbolSeries
   ...
 FillScale="{StaticResource ValueBrushScale}"
FillMemberPath="Population" />The following topics provide additional information related to this topic.