Thank you for your feedback! You have rated this topic in the last 30 days.
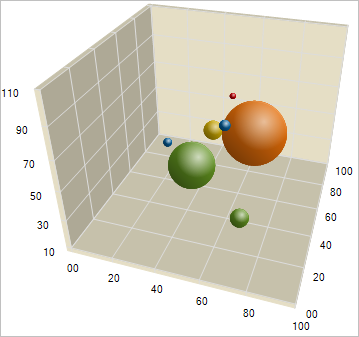
About 3D Bubble Charts
A 3D bubble chart is a type of 2D bubble chart that adds another dimension by plotting values in 3D space using X/Y/Z coordinates, plus an extra coordinate for the bubble radius.