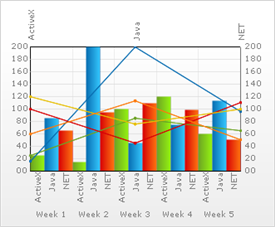
A column chart illustrates comparisons among items or shows data changes over a period of time. Values are organized vertically and data is categorized horizontally. A line chart shows trends in data at equal intervals.
The column line chart combines both types of charts, showing both categorized proportions and trends.