In the current version of XamDataChart series fitted lines can be added as trend lines.
LinearFit, QuadraticFit etc.
But they are only shown as graphical lines. The fit results and the quality of fit parameters are essential for scientific calculations and presentations.
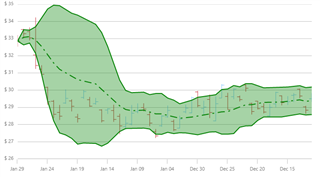
With financial charts it is possible to display additional band information to trend lines as eg. Bollinger.

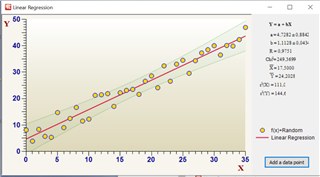
Please give us an option to display fitted lines results and confidence intervals as in the below picture.
