Author
Jason Beres
Published posts 24As the Sr. VP of Developer Tools at Infragistics, Jason and his global team spearhead the customer-driven, innovative features and functionality throughout all Infragistics' developer focused tools, UX tools and business solutions. With 25+ years industry experience and 17 years at Infragistics, Jason has established formal functions for Product Management, Technical Evangelism & Services at Infragistics and currently runs Product Development. Jason is the author of 10 books and dozens of magazine articles on enterprise software development, covering topics like SQL Server, C#, Rich Client and Web Development. Jason is a national and international conference speaker, a former 11-year Microsoft MVP and keeps very active in the UX & developer community. You can follow Jason at @jasonberes on Twitter.

TL;DR If you’ve built an admin CRUD app before, you know the routine: a grid that’s almost right, a half-finished modal form, a “we’ll do row editing later” sticky note, and three weeks of “filter doesn’t work on date columns” tickets. I rebuilt the classic Northwind admin console in less than 30 minutes — full CRUD across […]

Learn how to build an enterprise React Data Grid with Claude Code, Ignite UI for React, the Ignite UI CLI, Agent Skills, and MCP servers. See two workflows: adding Ignite UI to an existing React app or starting from the Ignite UI CLI.

Choosing between a React Tree Grid and a Hierarchical Grid can significantly impact your app’s performance, usability, and scalability. While both components handle hierarchical data, they serve different purposes. A Tree Grid is ideal for recursive datasets where each level shares the same structure, such as categories or org charts. In contrast, a Hierarchical Grid is better suited for relational data with distinct entities at each level, like customer → order → line item. Understanding when to use each approach helps prevent costly refactoring and ensures a more intuitive user experience as your application grows.

AI-Assisted React Data Grid Development: MCP Server + Copilot Skills is about making AI-generated React code more trustworthy for real UI work.
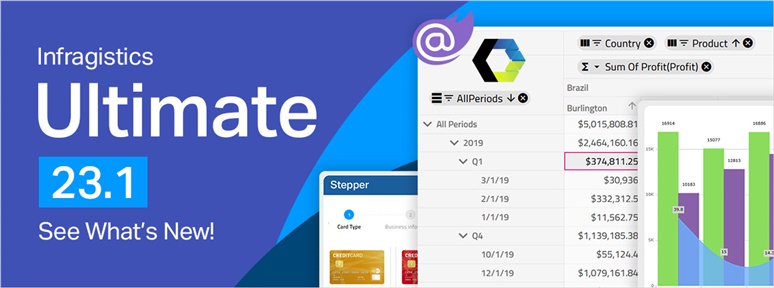
Exciting brand-new updates await in Infragistics Ultimate 23.1! From App Builder to next-generation charting, and new Blazor + Web Components controls.
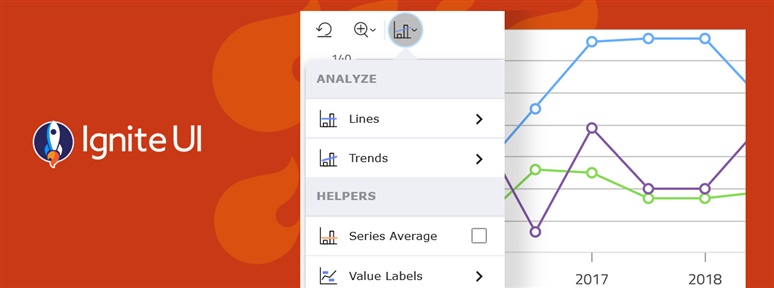
The Chart Toolbar, introduced in 23.1 as a Preview component, is a companion container for UI actions that may be used independently or in conjunction with the Data Chart and Category Chart components. This allows you to simply select from a predefined set of properties on the chart to perform deeper data analysis on the data displayed in the chart.
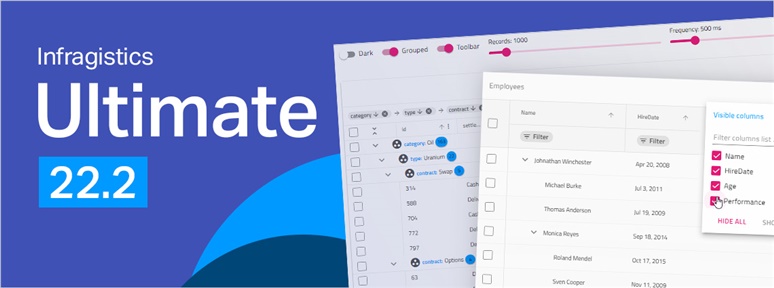
Infragistics Ultimate 22.2 comes with new features and UI controls, more capabilities in App Builder, new Web Components code-generation and more. Learn more!Infragistics

Building vs buying a component library: what to choose? We are trying to answer the question and help developers make an informed decision that won't cost them their budget and time.

With today's launch, we are very excited to get Infragistics Ultimate 22.1 into your hands. New features and UI controls, more capabilities, better design, and more.

Terms for Blazor components and Razor components are widely used interchangeably. But Blazor and Razor are two different things. Learn all about Razor vs Blazor and see how to use each in Ignite UI.