Skip to content

Infragistics Community Forum / Web / Ignite UI for Angular / How to set custom tooltip in Data Chart (Line Chart)?

How to set custom tooltip in Data Chart (Line Chart)?

New Discussion
Luca Scurati
Luca Scurati asked on Sep 10, 2020 1:06 PM

Hi,
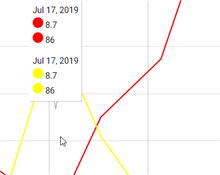
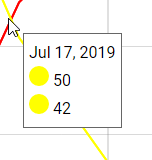
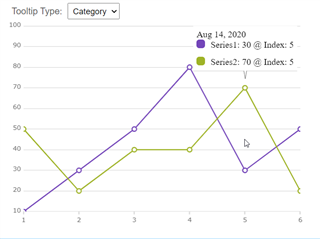
I need to customize the tooltip for my date chart, but following the documentation I can’t set it, and it remains the default one. Do you have any advice on how to do it?

Thanks

Sign In to post a reply

Replies

  • 0
    Michael DiFilippo
    Michael DiFilippo answered on Aug 27, 2020 5:35 PM

    Hello Luca, 

    Thank you for contacting Infragistics.

    The DataChart's series has a TooltipTemplate property that you can wire up your own ng-template. 

    eg. https://stackblitz.com/edit/github-wb4n6j

       
              {{item.Country}}: {{item.Coal}}
        
        
    ...


    //Custom tooltip
            
       
    //Default tooltip


    • 0
      Luca Scurati
      Luca Scurati answered on Aug 28, 2020 2:12 PM

      Hi Michal
      Thanks for the reply
      I tried and now it works!!, but in my case, i need that the tooltip always comes out, not just when you hover over the series. The type that comes closest is the category tooltip but the way I structured the template displays the data twice.
      What I managed to do is this

      Instead I would need something like this, done with the default tooltip

      but with the ability to view it wherever you position the mouse and not just when I pass over a series.
      The custom template code is this:


      {{item.Date | date}}
      {{item.Value[0] | number}}
      {{item.Value[1] | number}}

      Is it therefore possible to make it display them only once, as in the second image, but with each value next to the color of the corresponding series?

      Thanks,
      Luca

      • 0
        Michael DiFilippo
        Michael DiFilippo answered on Aug 28, 2020 6:24 PM

        You'll need to have different axes. All series with shared axes will be displayed by the same tooltip.

      • 0
        Luca Scurati
        Luca Scurati answered on Sep 1, 2020 6:41 AM

        But if I do this every time I get the tooltip with the data of a single series, instead I need to see the data of all the series everytime

      • 0
        MARTIN TRELA
        MARTIN TRELA answered on Sep 1, 2020 7:31 PM

        Hello Luca, 

        Here is sample app using custom tooltip template with IgxCategoryToolTipLayerComponent to show combined tooltip for multiple series

        dc_2D00_hover_2D00_tooltips.zip

      • 0
        Luca Scurati
        Luca Scurati answered on Sep 3, 2020 9:48 AM

        Hi Martin,
        thank you for your answer. Now I managed to set the tooltip as desired, like this:

        But now I have another "problem". Is it possible somehow to make the tooltip "follow" the mouse pointer, so that the tooltip is always close to the mouse pointer and not in a fixed position? And then is it possible to remove or change the style of the tooltip container, because I changed the style of the tooltip so that the background is gray, but the outline remains white …. This is the code of the tooltip style:

        style="background-color:#6f6f6f; color:white; border-radius:5px; border-color:#6f6f6f; font-size:15px"

        Thanks,

        Luca

      • 0
        MARTIN TRELA
        MARTIN TRELA answered on Sep 3, 2020 6:20 PM

        Currently, only the Item Tooltip Layer can places a tooltip at intersection of vertical line (running through X position of mouse cursor) with series line(s) You will need to request a new feature on this website If you want to render a tooltip exactly at position of mouse cursor regardless of data plotted in the chart. Alternatively, you could implement a new component that renders over the chart plot area at mouse position which you can get with this code:

        public componentDidMount() {
                const elem = document.getElementById('chart');
                elem.addEventListener('mousemove', this.onMouseMove, false);
            }
        
         public onMouseMove = (e: any) => {
                const bounds = e.target.getBoundingClientRect();
                const relativeCoordinates = {
                    x: e.clientX - bounds.left,
                    y: e.clientY - bounds.top
                };
        
                const windowCoordinates = {
                    x: (e.clientX - bounds.left) / bounds.width,
                    y: (e.clientY - bounds.top) / bounds.height
                };
        	
        	// TODO update position of custom component (tooltip) using relative/window Coordinates
        
            }

        You can style the tooltip container using attached css file.

        theme_5F00_tooltips.zip

      • 0
        Luca Scurati
        Luca Scurati answered on Sep 9, 2020 7:49 AM

        Hi Martin,
        Thanks for your reply.

        I've tried to implement a new component as you indicated. But how can I get data from the graph in this way? I'll explain. Every time I move the mouse the tooltip is displayed, but in this tooltip I have to show the values of the graph corresponding to that position. For example, if I position the mouse on 09/09/2020 within the tooltip, I must be able to see the 09/09/2020 date and the values that the different series assume on that date. How can I get this information using the x and y coordinates? Or is there another way?

        Thank you

        Luca

      • 0
        Michael DiFilippo
        Michael DiFilippo answered on Sep 10, 2020 1:06 PM

        Hello Luca, 

        As Martin suggested there is no continuous mouse tooltip interaction. 

        You can suggest new product ideas for future versions (or vote for existing ones) at <https://es.infragistics.com/community/ideas>.
        Submitting your idea will allow you to communicate directly with our product management team, track the progress of your idea at any time, see how many votes it got, read comments from other developers in the community, and see if someone from the product team has additional questions for you.
        Remember when submitting your idea to explain the context in which a feature would be used and why it is needed as well as anything that would prevent you from accomplishing this today. You can even add screenshots to build a stronger case. Remember that for your suggestion to be successful, you need other members of the community to vote for it.

        Let me know if you have any questions.

  • You must be logged in to reply to this topic.
Discussion created by
Favorites
Replies
Created On
Last Post
Discussion created by
Luca Scurati
Favorites
0
Replies
9
Created On
Sep 10, 2020
Last Post
5 years, 5 months ago

Suggested Discussions

Created by

Created on

Sep 10, 2020 1:06 PM

Last activity on

Feb 18, 2026 12:59 PM